

Quand les cartes mentent (ou pas)
Chris Lamphear Healthiest vs Unhealthiest - United States Map
Red = unhealthiest states, White = healthiest states, based on 21 health factors measured in 2005.
Health Care State Rankings, Morgan Quinto Press
http://www.3icreative.com/psych/health-statistics.html
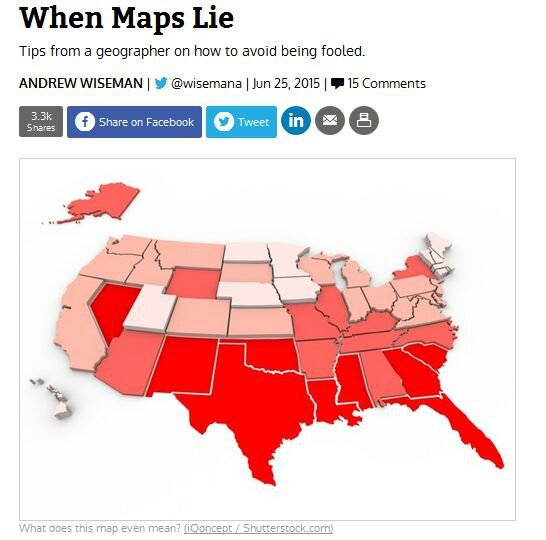
- When Maps Lie, Andrew Wiseman, Citylab.com (via Seth Dixon, twitter)
AW teaches cartography and GIS at the George Washington U. in Washington, D.C.
Quand les cartes mentent
dans leur conception,
ou dans leur usage public et médiatique,
par manque de qualification ou par manipulation délibérée
http://www.citylab.com/design/2015/06/when-maps-lie/396761/
Don’t trust a title
The source is important
Heat and density maps can confuse
What is the cartographer trying to show? What are they trying to hide?
The way the data is distributed is important
Choropleth maps can be tricky
Base data is important, too
But maps are still good
« None of this means that all maps are bad, or that we should always be suspicious of them, or that only experts should make maps.
Maps are inherently interesting and fun (so is geography!), but a little bit of thought and increased awareness of how they can manipulate or obscure is a good thing, too. Just like advertisements and political campaigns, we shouldn’t trust maps (or the data behind them) inherently, but they can still be powerful, interesting and amusing »
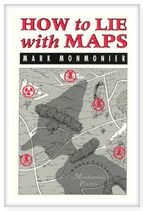
- L’article rappelle l'ouvrage de Mark Monmonier, How to Lie With Maps, 1ere édition Chicago 1991
http://www.markmonmonier.com/bio.htm
Comment faire mentir les cartes, ou du mauvais usage de la géographie 1993
compte rendu
http://www.persee.fr/doc/spgeo_0046-2497_1994_num_23_3_3317
version anglaise en ligne en pdf (187 p) :
http://trabajofindemaster.pbworks.com/f/Monmonier+M.-How+to+Lie+with+Maps.pdf

- A Tale from the Map Vault, Jeffrey Murray
http://www.collectionscanada.gc.ca/education/008-3060-e.html
dont Figure 7. "Allied air offensive against Germany."
(Library and Archives Canada, NMC 86740)
- Parmi les cartes (qui ne mentent pas) sélectionnées par Citylab
http://www.citylab.com/posts/maps/
. An Incredibly Detailed Map of Europe's Population Shifts
http://www.citylab.com/politics/2015/06/incredibly-detailed-map-europes-population-shifts/396497/

Durchschnittliche jahrliche Bevorelkerungsentwicklung von 2001-2011 in % in dem Gemeinden
http://www.bbsr.bund.de/BBSR/DE/Home/Topthemen/bevoelkerung_europa.html
http://www.demografie-portal.de/SharedDocs/Aktuelles/DE/2015/150612_BBSR_Bevoelkerungsentwicklung_Europa.html
(avec zoom)
http://blog.tagesanzeiger.ch/datenblog/index.php/9150/wo-die-bevoelkerung-in-europa-waechst-und-schrumpft
. An Imaginary City, 50 Years in the Mapping
Jerry Gretzinger has been working on his 1,500-square-foot map for much of his life.
http://www.citylab.com/design/2015/06/an-imaginary-city-50-years-in-the-mapping/394418/
. Chicago, Baltimore, St Louis, Memphis
Cities Fracture Along Racial Lines
An ongoing project visualizes segregation data in urban areas.
http://www.citylab.com/design/2015/06/in-these-powerful-maps-cities-fracture-along-racial-lines/395852/
. A 19th Century-Style Atlas, Made With 2015 Census Data
données de 2013-2015, une visualisation rétro
Non-English language at home 2013
http://www.citylab.com/design/2015/06/a-19th-century-style-atlas-with-new-census-data/396014/
. The Invisible Borders That Define American Culture - 2012
http://www.citylab.com/politics/2012/04/invisible-borders-define-american-culture/1839/
.


/http%3A%2F%2Fstorage.canalblog.com%2F54%2F85%2F161889%2F130176308_o.jpg)
/http%3A%2F%2Fstorage.canalblog.com%2F22%2F42%2F161889%2F129693609_o.jpg)
/http%3A%2F%2Fstorage.canalblog.com%2F79%2F52%2F161889%2F127712320_o.jpg)
/http%3A%2F%2Fstorage.canalblog.com%2F15%2F39%2F161889%2F127646645_o.jpg)
/https%3A%2F%2Fstorage.canalblog.com%2F02%2F17%2F161889%2F117651881_o.jpg)
/https%3A%2F%2Fstorage.canalblog.com%2F19%2F63%2F161889%2F117610470_o.jpg)